Weekly outlook, Week of 2nd–6th November 2026
WTI: failed breakout, sell $104.4–105.0
Flat price up on the week, every spread down. WTI Dec/Jan lost nearly a fifth, Brent Jan/Feb more than a tenth, and the Gulf Coast diesel crack fell from $100.5 to $96.8. Friday's tanker-strike breakout ran to $105.6 and closed back at the $103.8 VaH. Qatar is carrying a US peace proposal into the midterms. Sell the retest of Friday's high, target the $102.1 PoC.
- Crude oil
-
WTI crude USOUSD
Bearish below $105.6
Prior VaL$98.1Prior PoC$100.2VaL$101.3PoC$102.1VaH$103.8Wk high$105.6Sep high$106.8$103.7
Buy zone Sell zone Price at Friday's close. VaH, PoC, VaL: last week's 5-day composite. Prior PoC, Prior VaL: week of 19th October. Wk high: Friday's high. Sep high: September's high.
Cracks, spreads, flows
Paper rally. The barrel didn't follow. Flat price finished the week higher on tanker strikes. Every spread and the diesel cracks finished lower. That's war premium on top of a physical market that's starting to loosen.
The curve
WTI flattened. On Friday's settles against the Friday before, Dec/Jan lost nearly a fifth and Jan/Mar a tenth. The damage was done on Tuesday: Dec/Jan and Jan/Mar each gave up close to a fifth in one session. Friday's rally added about $2 to flat price and next to nothing to Dec/Jan. Nobody was paying up for prompt barrels on the tanker news.
Brent flattened too. Dec Brent expired on Friday, so January is now the front. Jan/Feb lost more than a tenth, and it was lower still on Wednesday. Jan/Mar lost about 9%. The Atlantic Basin is still tight, but less so every week.
The arb held open. The Brent–WTI Jan futures spread finished the week a little wider. It dipped midweek and came back with Friday's Hormuz bid, Brent leading. Physical is far wider: Dated Brent was $19.7 over WTI Cushing on Tuesday on EIA's spot prices, from $18.6 on the 23rd. At those levels US crude keeps leaving the Gulf Coast. That drains the coast, not the hub.
Refinery margins
Diesel is cracking. On EIA's spot prices against WTI Cushing, the Gulf Coast ULSD crack went from $100.5 on Friday 23rd to $96.8 on Tuesday 27th. New York Harbor fell harder, $107.1 → $93.5. The East Coast premium over the Gulf flipped from +$6.6 to −$3.3 in two sessions. That's the East Coast shortage easing: PADD 1 distillate imports rose to 127,000 b/d from 79,000. The heating oil Dec/Jan futures spread eased too. Diesel was the floor under crude all October. It's still a strong margin, but it's no longer pulling crude higher.
The diesel tightness is real, though. Distillate stocks fell 1.5M bbl to 102.8M, 9.6% under the 5-year average and 9.4M bbl under a year ago. Distillate product supplied jumped to 4.21M b/d from 3.73M, against 3.58M a year ago. Distillate exports 1.32M b/d. This is a winter story, not a this-week story. The crack has room to fall before it bites on runs.
Gasoline is the weak leg. Gasoline stocks built 3.9M bbl to 209.2M. Gasoline product supplied fell to 8.36M b/d from 8.98M, under last year's 8.92M. The Gulf Coast gasoline crack is the weakest part of the barrel at $26.9, against $45.9 on 9th October. Total product supplied fell 1.0M b/d to 20.2M. Domestic demand is softening, and product exports at 7.67M b/d are carrying the refining system. Gulf Coast 3-2-1 flat at $50.2, down from $62.9 on 9th October. Jet $87.1 → $83.3.
Refiners are still running hard. Crude runs 16.53M b/d, 92.8% utilisation, down from 93.4%. Gulf Coast 94.9%. A year ago the system ran at 86.6%. That's peak crude demand. From here, runs only go one way into the January turnarounds.
Stocks and flows
Tight coast, full hub. Week to 23rd October: commercial crude down 1.9M bbl to 410.6M, 3.8% under the 5-year average. Cushing drew 0.6M bbl, its first draw in three weeks, but it still holds 27.0M, 9.3% over the 5-year average and 4.4M bbl over a year ago. A full hub can't carry this much Dec/Jan backwardation into expiry for long.
More crude coming in, more going out. Exports bounced 1.41M b/d to 4.85M after the previous week's 3.44M. Imports rose 0.62M b/d to 6.37M, with Gulf Coast imports up from 1.02M to 1.62M. Net crude imports fell to 1.52M b/d. Barrels are moving through the coast fast. They aren't backing up.
US supply is back. Production up 0.72M b/d to 13.99M, back at the record, as Gulf of Mexico platforms returned after the hurricane. Lower 48 13.51M. That's 0.7M b/d more crude a week than the market had in mid-October. The SPR is flat at 282.6M bbl, 35% under its 5-year average. Washington isn't releasing. (Charts.)
Positioning
Funds are leaving, not chasing. Managed money net long 31,100 WTI contracts in the week to 27th October, down 5,100. Seventh straight weekly cut, from 111,700 in early September. Longs cut another 6,000 to 157,400. Shorts barely moved at 126,300. The net sits in the bottom quarter of its 3-year range. That cuts both ways. There's no crowded long to liquidate, so a deal is a premium unwind, not a fund flush. And there's room to buy if talks fail.
Open interest rose 51,000 contracts to 1.89M on the week. Producers and merchants cut shorts by 2,900. Swap dealers added 4,200 longs. Producers aren't selling forward into $100+. That's no vote for higher prices: they're just not hedging a spike they don't expect to last.
The war
Hormuz is still being hit. On Thursday night a small boat attached explosives to a tanker's hull. On Friday, mines and remote devices hit four tankers on the bypass routes along the Omani coast, one 25nm northeast of Khasab. CENTCOM says the main channels are clear. The IRGC says the southern routes are mined. UKMTO logged 43 incidents in October, 30 of them direct strikes on tankers. On Saturday, Saudi air defences shot down a drone over Riyadh. The US is sending a third carrier strike group, due by late November.
Talks are the bigger story. Qatari mediators were back in Tehran on Friday with a US proposal for a temporary peace from Vice President Vance. Trump says the war will "end soon" and has ruled out strikes before Tuesday's midterms. Over the weekend Tehran said Hormuz could reopen within two days if its terms are met: end the US naval blockade, lift oil sanctions, unfreeze assets. Iranian negotiators left Qatar on Sunday. No deal yet, but the price of one is now public. Washington lifting oil sanctions is a big ask. A temporary arrangement that reopens the strait isn't.
Paper and physical are splitting. Futures are carrying the war risk. The physical market isn't. Gulf cargoes have been available at short notice all month, and Mideast sour differentials are well off their war highs. That makes this week binary. If the talks hold, futures have to come down to where physical already is. If strikes resume, the North Sea is the tightest hub in the world and Brent takes the move. That's why Brent carries more premium than WTI, and why a deal hits Brent harder.
OPEC+ is irrelevant this week. The core seven held December targets on Sunday at about 31M b/d. Next meeting 29th November. Most Gulf members are pumping well under target because they can't ship. Quotas don't matter until the strait does.
The balance sheet
The EIA's October STEO has the deficit ending this quarter. Q4 2026: demand 103.7M b/d, supply 103.0M, a 0.7M b/d draw. Q1 2027: supply 106.1M against demand 103.1M, a 3.0M b/d surplus. Q2 2027: a 4.9M b/d surplus. That assumes Gulf supply comes back. OPEC spare capacity is 0.02M b/d, effectively zero, and unplanned OPEC outages were 7.6M b/d in Q3.
The cushion is thin. Aramco's chief executive puts gross supply losses since the war began at nearly 3 billion barrels. The IEA had about 2.8 billion barrels of lost Hormuz exports by August. Strategic stocks have been drawn hard on top of that: the US SPR alone is 35% under its 5-year average, and the IEA's coordinated release is down to its last tranche. Hormuz flows recovered in September and October but are still under February's pre-war level. A second round lands on a system with far less buffer than in March. That's the tail the short has to respect.
The curve says the same thing. Jan/Mar is still a steep backwardation, but it's the market pricing a premium now that rolls off. Every week the war doesn't escalate, the backwardation bleeds and the Q1 surplus gets closer. A deal brings it forward by a quarter.
The balance. The physical bid is fading: spreads in, diesel crack in, Cushing full, US output back, runs at peak. What's left is premium, and the premium now rests on talks failing. Upside needs a fresh hit on infrastructure. Downside only needs the talks to keep going.
Last week
Balance week, then a failed breakout. Composite value: VaL $101.3, PoC $102.1, VaH $103.8. Range $100.2–105.6.
- Monday. Opened under the previous Friday's close and sold through Asia to $101. The US session squeezed to $103.7 and was sold back into the middle.
- Tuesday. The spreads broke: Dec/Jan and Jan/Mar each lost close to a fifth. Flat price followed it down to the week's low at $100.2, to the cent on the 19th October week's PoC. It held.
- Wednesday. EIA showed a 1.9M bbl crude draw, a Cushing draw and exports back over 4.8M b/d. Price rotated back to the PoC and above.
- Thursday. Tested $104.0, just over the VaH. Sold straight back to $100.5.
- Friday. The overnight hull bombing and then four tankers hit on the bypass routes. Two runs at $105.6, one in Asia and one in the US afternoon. Both were sold. The afternoon built a shelf at $104.4–105.0, then sold off into the close. Close $103.7, back at the VaH.
Four days of balance built value at $101.3–103.8. The breakout came on headlines, with spreads flattening, diesel cracks falling and funds selling. It double-topped at $105.6 and closed back at the top of value. No acceptance.
The last weekly outlook's pullback buy at the $96.2 VaH filled on 21st October. The low was $96.2, the stop wasn't touched, and the following Friday traded through both targets, $100.5 and $102.4.
The bigger picture
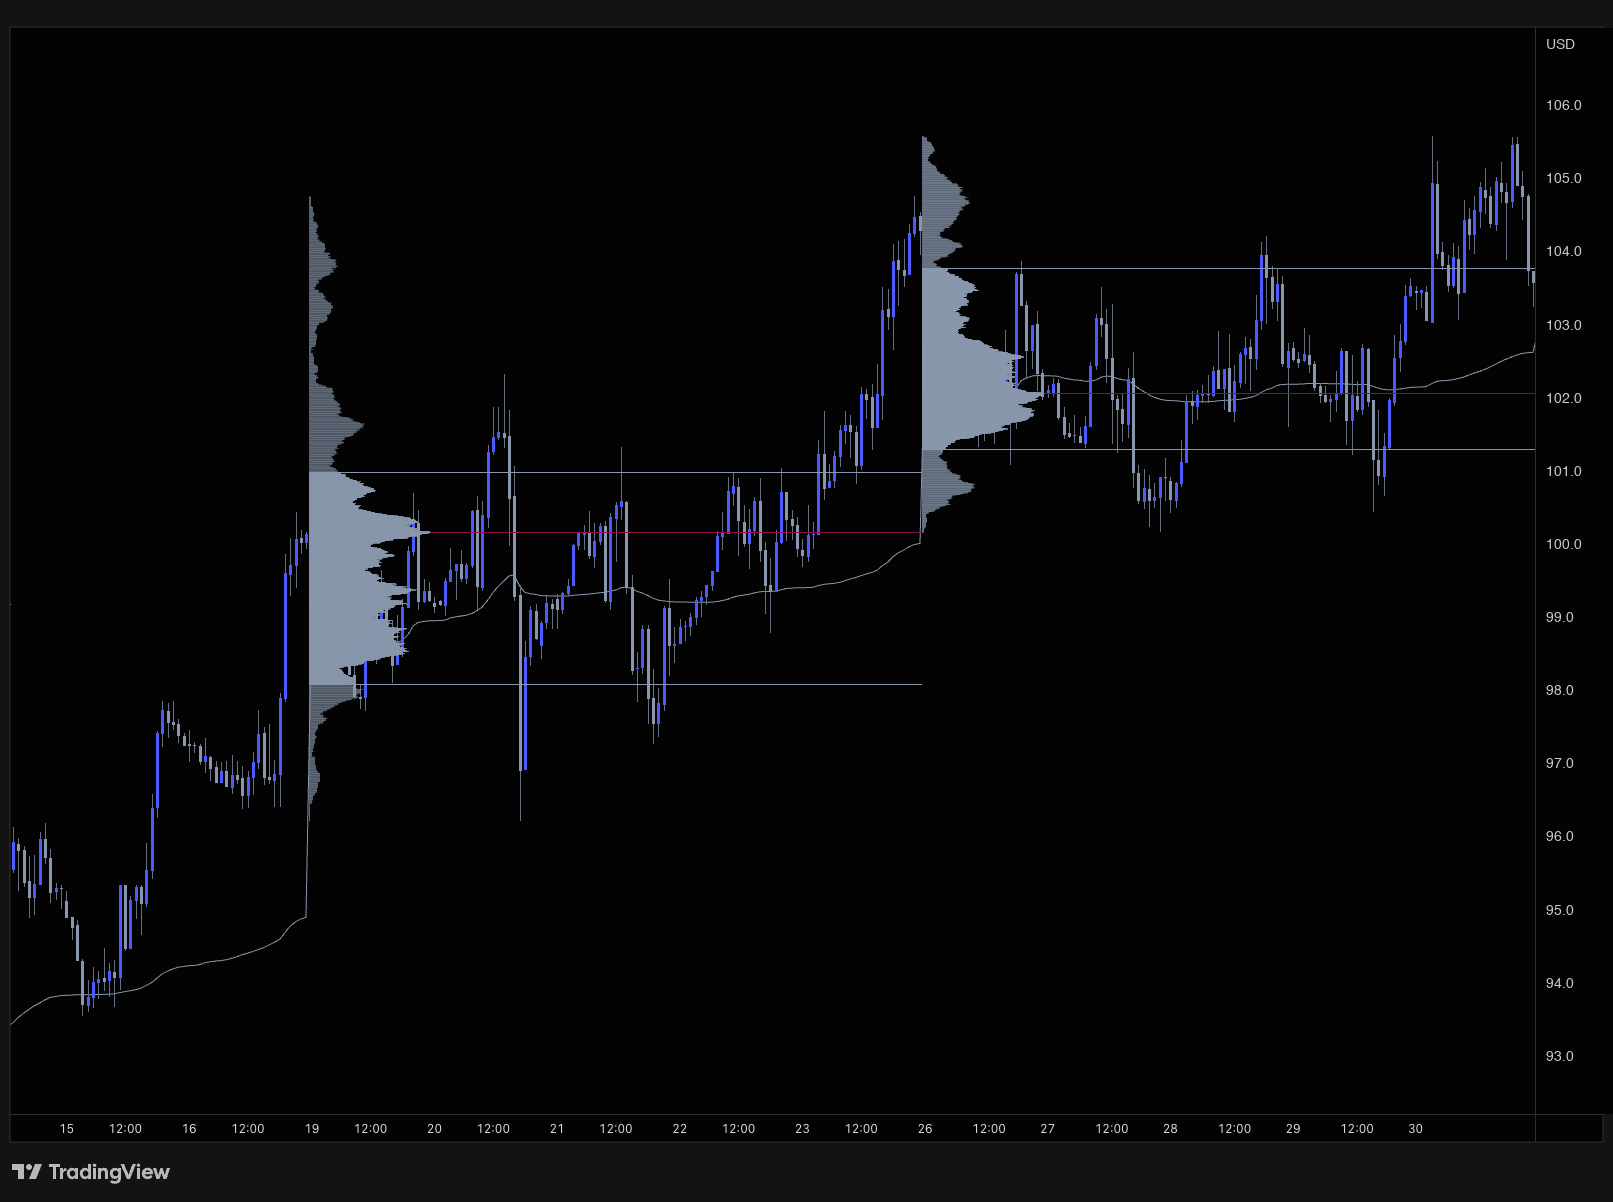
Above: Friday's $105.6 double top, then the September high at $106.8. Nothing else. Price has rejected that air twice, once on Friday and once in September. Above $106.8 there's no volume reference on the chart. That's where an escalation trade would go, and it'd go fast.
Below, the profile is stacked. Last week's value runs $103.8 to $101.3 with the PoC at $102.1. It's a fat, well-traded distribution, so expect two-way trade through it rather than a clean run. Then $100.2, last week's low and the 19th October week's PoC. Two weeks of business sit at that price. Below that is the 19th October value area down to $98.1. Under $98.1 the profile is thin to $96.2, the breakout level from the week of 12th October. A gap under $100.2 on a deal could travel that fast.
The month: October made its low at $88.4 on 6th October and finished up about 15%, the biggest monthly gain since July. All of it came in three weeks. The last two weekly value areas, $98.1–101.0 and $101.3–103.8, sit stacked with a $0.3 gap. Value is still migrating up, but slowly, while the spreads go the other way. Last week's range, $5.4, was the narrowest of the month's three up-weeks. The market has stopped trending and started balancing at the highs.
Scenarios for the week
- Base case: back into value. Friday's failure plays out. The retest of $104.4–105.0 sells, and price rotates to the $102.1 PoC. Talks keep going, the premium bleeds, and $101.3 goes too.
- Gap down on talks. A credible interim deal or a Hormuz reopening date gaps price under $101.3. The sell zone is missed. Don't chase it. $100.2 is the last shelf. Below that, $98.1 comes fast. Watch Brent–WTI on a deal: Brent carries more of the premium, so the arb narrows and WTI falls less.
- Escalation after the vote. Trump's no-strike pledge expires with Tuesday's midterms. A third carrier group arrives by late November. A US or Israeli strike, or a hit on Gulf infrastructure, takes out $105.6 and runs at $106.8, with Brent leading. That's the risk to the short. The stop is above Friday's high for that reason.
- Chop. No deal and no strike. Price stays in $101.3–105.6, and spreads keep bleeding while that holds. Fade both edges.
Watch Dec/Jan. Back to its 23rd October level with flat price up means the physical bid is back. Sell setup off.
What matters in Wednesday's EIA
- Cushing. Another draw toward 25M bbl supports Dec/Jan into the 19th November expiry. A build back over 27.5M confirms the flattening.
- Exports. Over 4.5M b/d means the $11 arb is working and the coast keeps draining. Under 4M means it's stopped.
- Runs. Utilisation under 92% is the start of the seasonal slide in crude demand.
- Distillates. A third straight draw with product supplied over 4M b/d puts the Gulf Coast diesel crack back over $100. That's the bull case in the barrel.
- Production. Holding near 14M b/d confirms the Gulf of Mexico is fully back.
WTI levels and setups
Short. Sell the retest of Friday's shelf. No long this week: the barrel isn't confirming, and a gap lower on talks is more likely than a gap higher.
Sell setup retest of the failed breakout
- Sell zone
- $104.4 – $105.0 Friday's afternoon shelf, under the $105.6 high
- Stop-loss
- $106.0 Above Friday's high
- Targets
- $102.1 / $100.2 Last week's PoC, then last week's low on the 19th October week's PoC
Invalidation: Daily close above $105.6: Friday's high taken, no sell. Daily close above $106.8, September's high: bearish bias off for the week. Between $103.8 and $105.6, flat.
| Level | What it is | Role this week |
|---|---|---|
| $106.8 | September high | Bias flips above |
| $105.6 | Last week's high (Friday double top) | Failed breakout; stop above |
| $104.4–105.0 | Friday's afternoon shelf | Sell zone |
| $103.8 | Last week's 5-day composite VaH | Weekly pivot |
| $102.1 | Last week's 5-day composite PoC | First target |
| $101.3 | Last week's 5-day composite VaL | Bottom of last week's value |
| $100.2 | Last week's low; PoC, week of 19th October | Second target; major support |
| $98.1 | VaL, week of 19th October | Support under the gap |
| $96.2 | VaH, week of 12th October | Breakout level; last line |
What would change the view
Daily close above $106.8: September's high taken, bias back to bullish. In the barrel: WTI Dec/Jan back to its 23rd October level or the Gulf Coast diesel crack back over $100 with flat price up means real buying has returned. In the news: talks collapse and strikes resume after Tuesday. Any of these, and this outlook gets updated.
December WTI expires on 19th November. A full Cushing into expiry is the next test for Dec/Jan. Further out, the January Gulf Coast turnarounds and the STEO's Q1 surplus both point lower. The war is the only thing holding the curve up.
The week ahead (London time)
- Monday 15:00: US ISM manufacturing (October)
- Tuesday: US midterm elections. Results through Wednesday's Asian session.
- Tuesday 21:30: API weekly crude stocks
- Wednesday 15:00: US ISM services (October)
- Wednesday 15:30: EIA Weekly Petroleum Status Report
- Thursday 13:30: US weekly jobless claims
- Friday 13:30: US jobs report (October)
- Friday 18:00: Baker Hughes US rig count
- Friday 20:30: CFTC Commitments of Traders (positions as of Tuesday)
US clocks went back on Sunday. US data is at 13:30 GMT and EIA at 15:30 GMT again. Weekend headline risk carries into Monday's open both ways: Qatar-brokered talks, strikes on the bypass routes.
Cracks and Dated Brent–WTI are calculated from EIA daily spot prices against WTI Cushing (latest published: Tuesday 27th October). Timespreads are described from futures settlements, not quoted. Prices are taken from a CFD feed (USOUSD) and can differ from futures prices and from your broker's quotes.