Daily note, Thursday 15 October 2026
WTI tests the 95.64 PoC after a big API draw
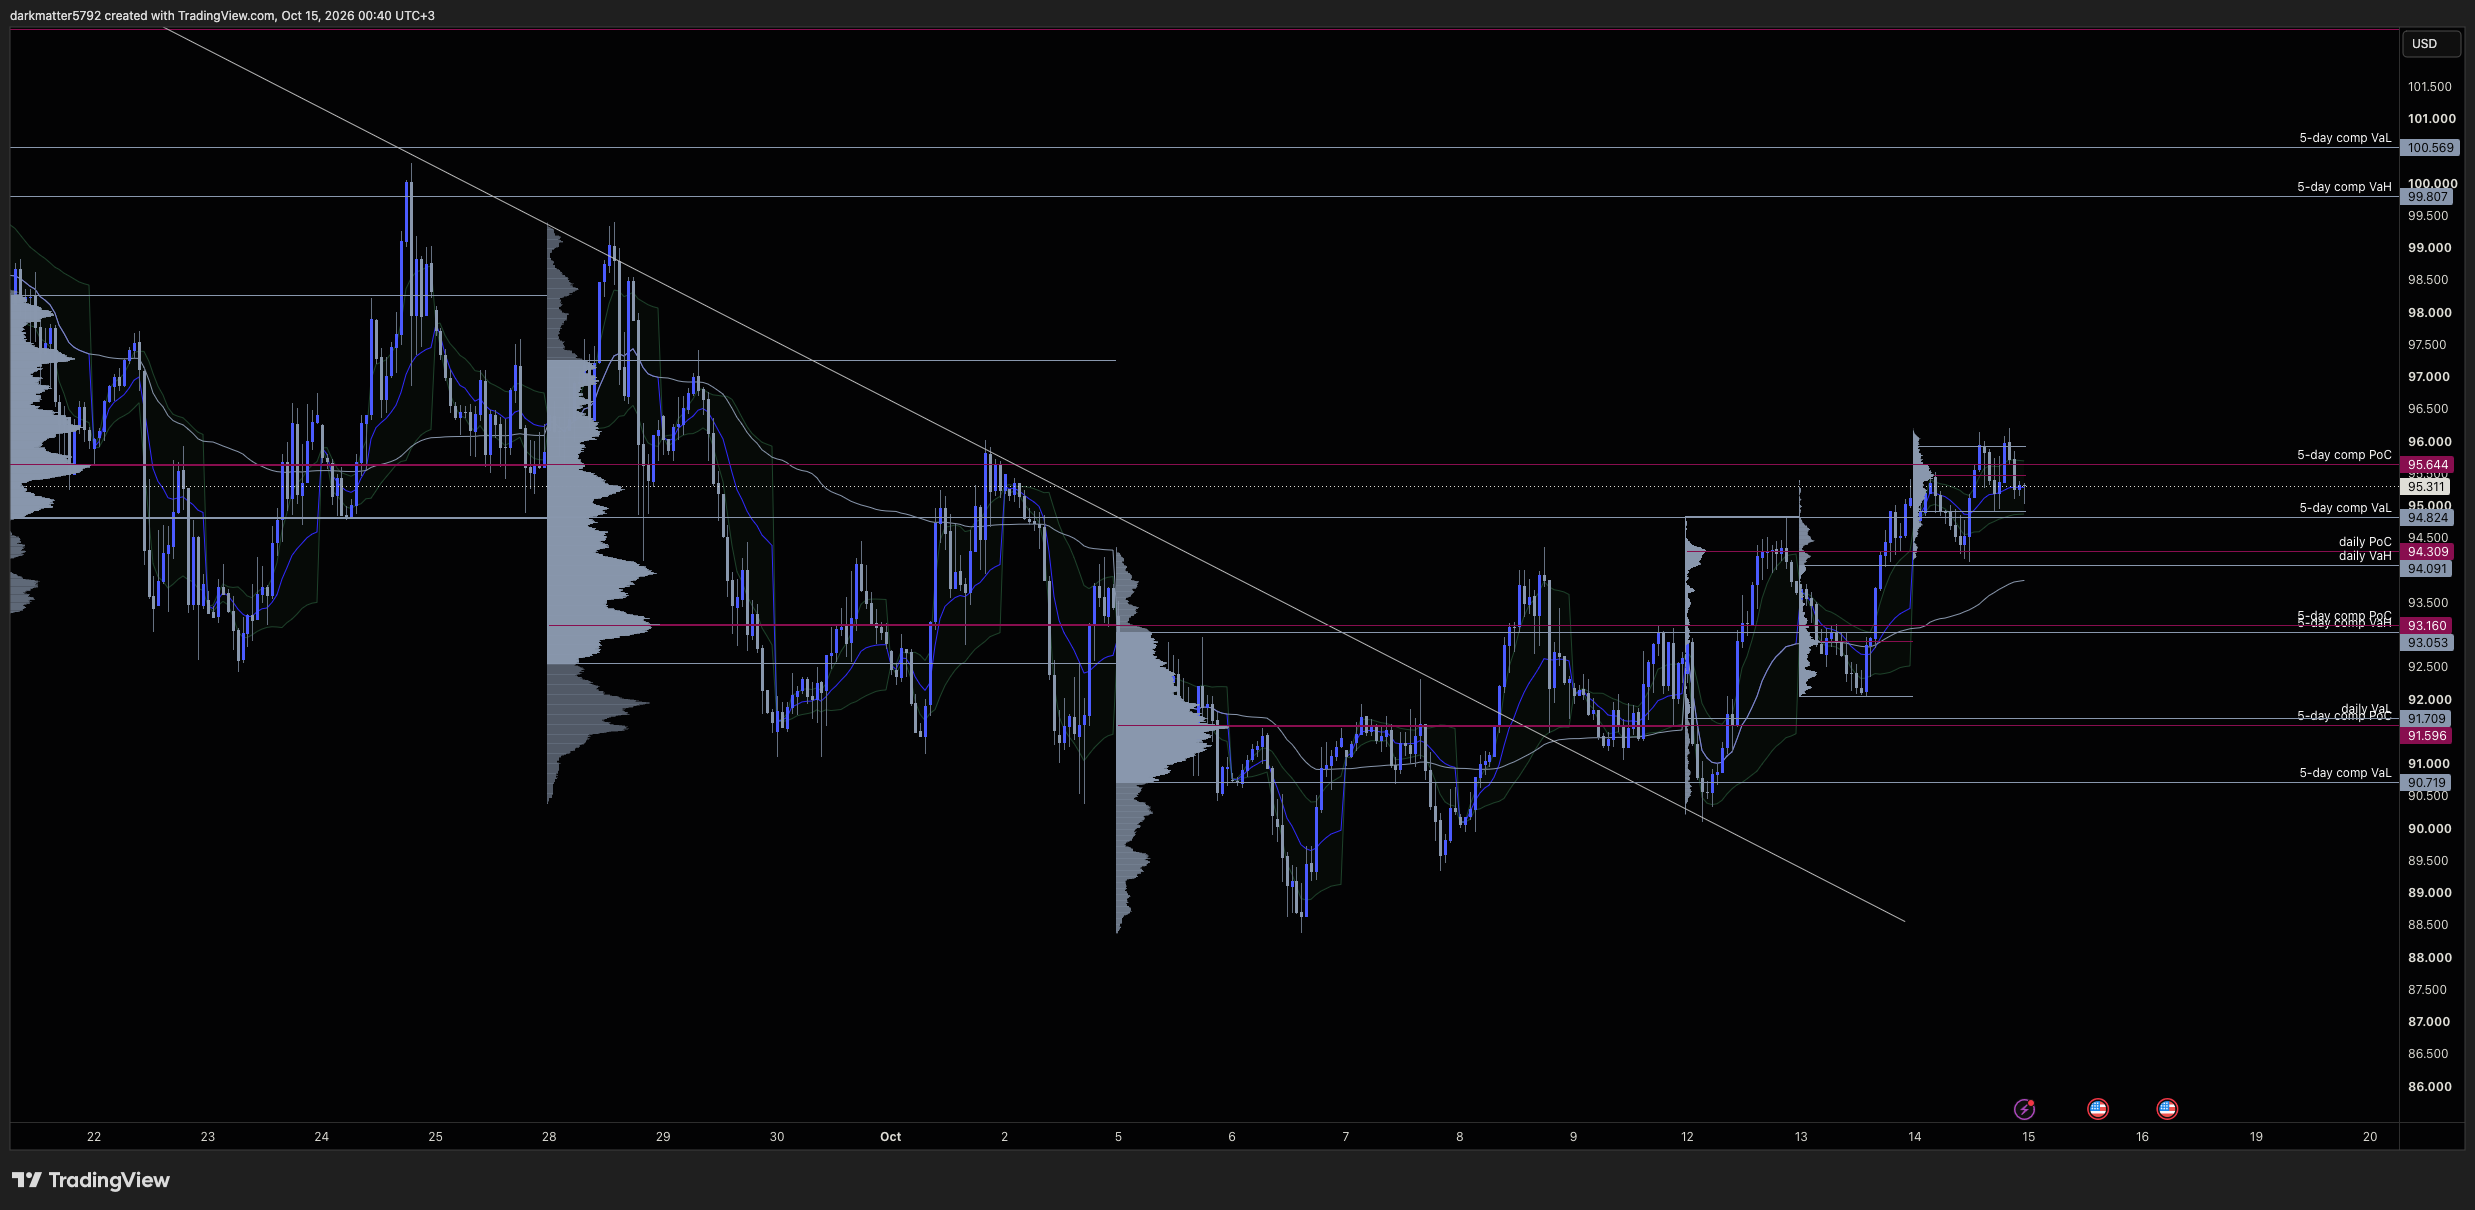
WTI has broken its September downtrend and is building higher value, now pressing into the 95.64 composite PoC. An 11.1M-barrel API draw and Middle East supply risk back the bullish view. Buy zones, stops and targets from the volume profile.
Prices as of 14 Oct 2026, at 21:40 UTC, after the API report
- Crude oil
-
WTI crude USOUSD
Bullish above 93.05
VaL90.72PoC91.60PoC93.16dPoC94.31VaL94.82PoC95.64VaH99.81VaL100.5795.31
Buy zone Sell zone Price at 21:40 UTC, after the API report. Ticks are volume profile levels: PoC is the point of control, VaH and VaL the value area high and low, dPoC the daily PoC.
The picture
WTI has changed character this week. The descending trendline from the 22 September high gave way on 8–9 October. The retest on 12 October held near 90.40, and since then each session has made a higher low: about 92.05 on 13 October and 94.14 on 14 October. Price has climbed out of the old composite value, cleared the 93.05–93.16 PoC and VaH, and is now building value higher up.
Wednesday's session ran up to 96.21 and was sold back under the naked 5-day composite PoC at 95.64, a level left over from the 21–25 September profile. At 21:40 UTC it was trading at 95.31, inside a small balance between about 94.90 and 96.00. The 95.64 PoC is the line in the sand for the next leg.
Fundamentals
The supply story still leans bullish. Houthi attacks on Saudi Arabia escalated again this week, including a strike on a Saudi Aramco administrative building on Tuesday night, and Iran's IRGC Navy is claiming control of the Strait of Hormuz. The IEA's October report warned that diesel tightness could last well into 2027. After the close, the API reported an 11.1M-barrel crude draw against an expected build of 1.9M. If Thursday's official EIA figures (16:00 UTC) confirm a draw of that size, it would support the move through 95.64.
There are offsets. Saudi output recovered by about 2M bpd in September, Hormuz flows are back to roughly 80% of pre-war levels according to Shell, and US production is at a record 13.98M bpd. Wednesday's hot CPI also lifted the dollar, which is a headwind. With Goldman Sachs estimating a $24 risk premium in the price, headlines can move crude several dollars in either direction, so size positions accordingly. Average daily range is about $4.
WTI levels and setups
The preferred trade is to buy a pullback into the value built on 13–14 October, not to chase into the 95.64 PoC. Hourly acceptance above 96.21 (Wednesday's high) would open 97.25 and then the prior composite value area at 99.81–100.57, where a reaction is likely on the first test.
Buy setup preferred
- Buy zone
- 94.09 – 94.35 Daily VaH and PoC, just under the 94.82 VaL
- Stop-loss
- 93.55 Below the 14 October low (94.14) and back towards old value
- Targets
- 95.64 / 96.20 / 97.25
Buy setup deeper pullback
- Buy zone
- 93.05 – 93.20 5-day composite PoC and VaH, the breakout base
- Stop-loss
- 92.40 Back inside the old value area
- Targets
- 94.82 / 95.64
Sell setup only on rejection
- Sell zone
- 99.80 – 100.60 Prior 5-day composite value area
- Stop-loss
- 101.30
- Targets
- 97.25 / 95.64
Invalidation: hourly acceptance back below 93.05 puts price back inside the old composite value and turns the bias neutral, with 91.60–91.71 next.
| Level | What it is | Role today |
|---|---|---|
| 99.81–100.57 | Prior 5-day composite value area | Major resistance band |
| 97.25 | Level from the 28 Sep–2 Oct profile | First target above 96.21 |
| 96.21 | 14 October high | Breakout trigger |
| 95.64 | 5-day composite PoC (naked) | Resistance now; pivot for the day |
| 94.82 | 5-day composite VaL | First support |
| 94.09–94.31 | Daily VaH and PoC | Preferred buy zone |
| 93.05–93.16 | 5-day composite VaH and PoC | Breakout base; bias holds above |
| 91.60–91.71 | 5-day composite PoC and daily VaL | Support if 93.05 fails |
| 90.72 | 5-day composite VaL | Range floor; bias turns bearish below |
Today's calendar (UTC)
- 02:55: Fed's Bowman speaks
- 12:30: US PPI (0.5% m/m expected), retail sales (0.3% expected), jobless claims, Philly Fed and Empire State surveys
- 16:00: EIA weekly crude, gasoline and distillate stocks
- Friday 03:30: Fed Chair Warsh speaks
Wait for price to reach a zone and show a reaction on the 15-minute or hourly chart before entering. Stand aside in the minutes around 12:30 and 16:00 UTC. Prices are from Vantage's USOUSD feed and can differ from NYMEX futures and from your broker's quotes.